Real apps. Real numbers. No excuses.
14
Android products shipped. Zero with a jank budget.
Every project below shipped with documented frame rates, retention lifts, and interaction benchmarks. Pick any one and ask us to prove it.


Clearpath Mobile Banking
Rebuilt the transaction flow from the render thread up. Touch response dropped to 14ms. Day-30 retention climbed 22 points after launch.
14 ms touch latency — 22 pt retention lift
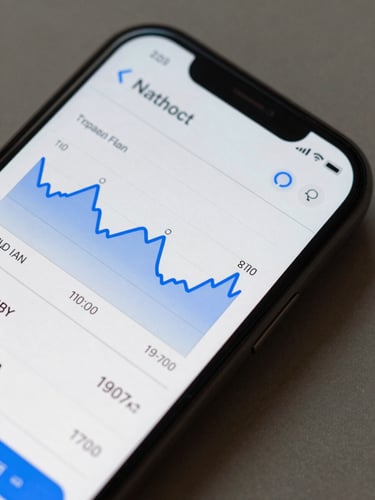
Vitals — Real-Time Health Tracker
Sensor polling at 60 fps with zero dropped frames in a week of stress testing. Crash-free rate hit 99.94% in the first 90 days post-launch.
60 fps sustained — 99.94% crash-free rate
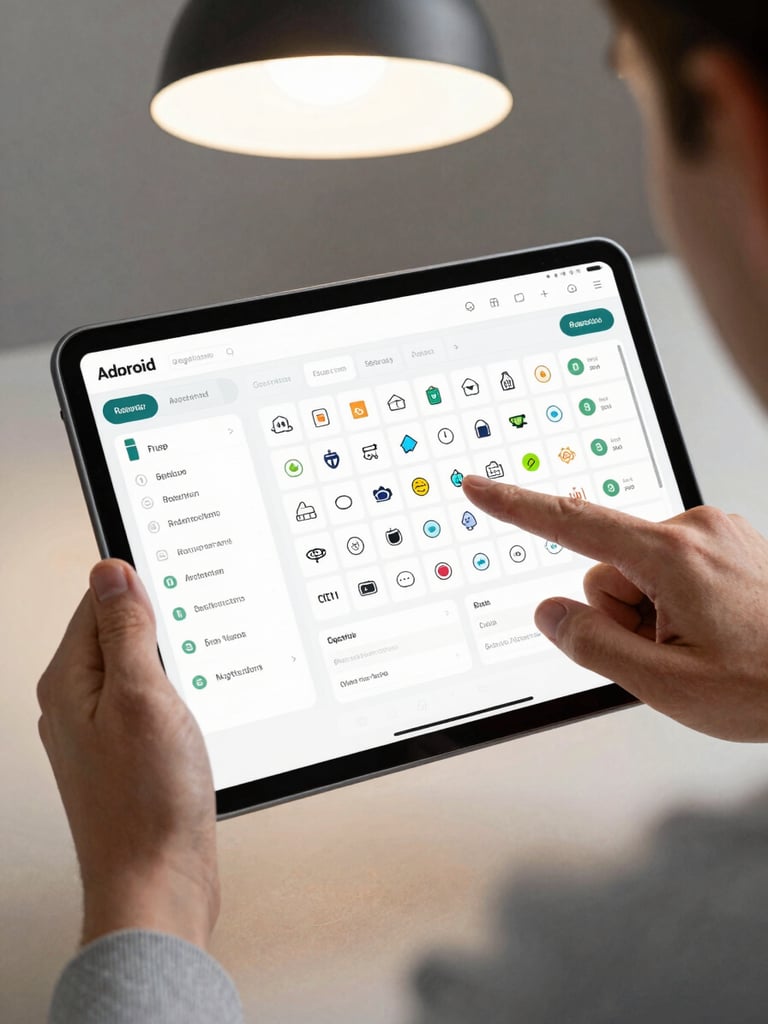
Dispatch — Fleet Operations Hub
Dense data tables that scroll at 60 fps on mid-range hardware. Driver onboarding time cut by 34% because the UI stopped requiring explanation.
60 fps on mid-range — 34% faster onboarding
The standard holds. Always.
< 16 ms
99.9%+
+19 pts
Average touch-to-response latency across shipped apps. One frame budget, every time.
Crash-free session rate at 90 days post-launch, measured across all production apps.
Median Day-30 retention improvement versus the client's previous app version.
Seen enough to want a conversation?
Bring your project, your current performance pain points, and any hard numbers you have. We'll tell you exactly where we can help.